4. Feature Preprocessing
4.1. Missing Values
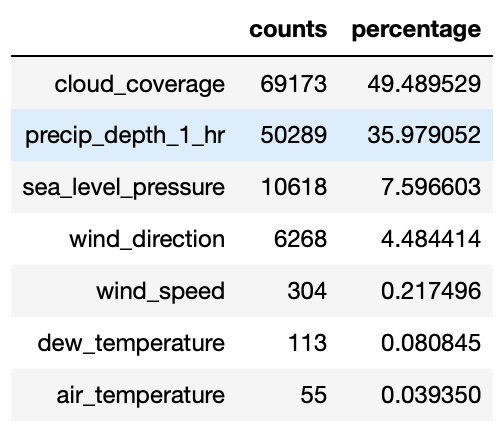
Machine learning models cannot accept null/NaN values. We will need to either remove them or fill them with a logical value. To investigate how many nulls in each column:
def null_analysis(df):
'''
desc: get nulls for each column in counts & percentages
arg: dataframe
return: dataframe
'''
null_cnt = df.isnull().sum() # calculate null counts
null_cnt = null_cnt[null_cnt!=0] # remove non-null cols
null_percent = null_cnt / len(df) * 100 # calculate null percentages
null_table = pd.concat([pd.DataFrame(null_cnt), pd.DataFrame(null_percent)], axis=1)
null_table.columns = ['counts', 'percentage']
null_table.sort_values('counts', ascending=False, inplace=True)
return null_table
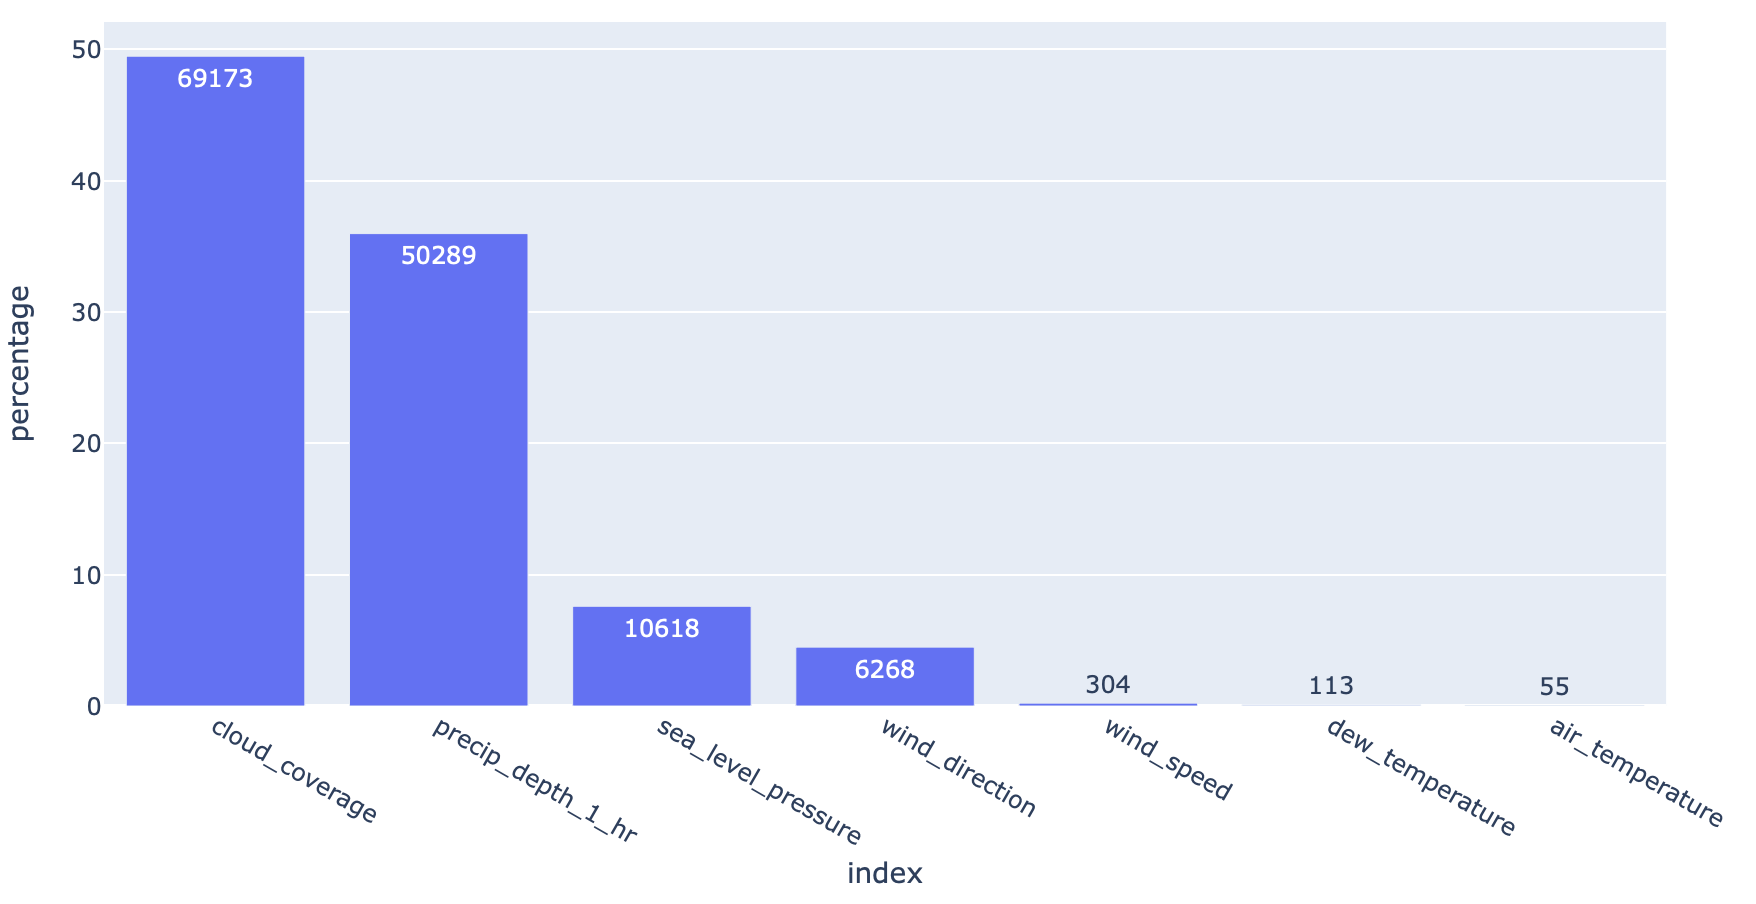
# visualise null table
import plotly_express as px
null_table = null_analysis(weather_train)
px.bar(null_table.reset_index(), x='index', y='percentage', text='counts', height=500)
4.1.1. Threshold
It makes no sense to fill in the null values if there are too many of them. We can set a threshold to delete the entire column if there are too many nulls.
def null_threshold(df, threshold=25):
  '''
  desc: delete columns based on a null percentage threshold
  arg: df=dataframe; threshold=percentage of nulls in column
  return: dataframe
  '''
  null_table = null_analysis(df)
  null_table = null_table[null_table['percentage']>=25]
  df.drop(null_table.index, axis=1, inplace = True)
  return df
4.1.2. Impute
We can change missing values for the entire dataframe into their individual column means or medians.
import pandas as pd
import numpy as np
from sklearn.impute import SimpleImputer

impute = SimpleImputer(missing_values=np.nan, strategy='median', copy=False)
imp_mean.fit(df)
# output is in numpy, so convert to df
df2 = pd.DataFrame(imp_mean.transform(df),columns=df.columns)
4.1.3. Interpolation
We can also use interpolation via pandas default function to fill in the missing values. https://pandas.pydata.org/pandas-docs/stable/reference/api/pandas.Series.interpolate.html
import pandas as pd

# limit: Maximum number of consecutive NaNs to fill. Must be greater than 0.
df['colname'].interpolate(method='linear', limit=2)
4.2. Outliers
Especially sensitive in linear models. They can be (1) removed manually by defining the lower and upper bound limit, or (2) grouping the features into ranks.
Below is a simple method to detect & remove outliers that is defined by being outside a boxplot’s whiskers.
def boxplot_outlier_removal(X, exclude=['']):
    '''
    remove outliers detected by boxplot (Q1/Q3 -/+ IQR*1.5)

    Parameters
    ----------
    X : dataframe
      dataset to remove outliers from
    exclude : list of str
      column names to exclude from outlier removal

    Returns
    -------
    X : dataframe
      dataset with outliers removed
    '''
    before = len(X)

    # iterate each column
    for col in X.columns:
        if col not in exclude:
            # get Q1, Q3 & Interquantile Range
            Q1 = X[col].quantile(0.25)
            Q3 = X[col].quantile(0.75)
            IQR = Q3 - Q1
            # define outliers and remove them
            filter_ = (X[col] > Q1 - 1.5 * IQR) & (X[col] < Q3 + 1.5 *IQR)
            X = X[filter_]

    after = len(X)
    diff = before-after
    percent = diff/before*100
    print('{} ({:.2f}%) outliers removed'.format(diff, percent))
    return X
4.3. Encoding
4.3.1. Tree-Based Models
- Label Encoding: or conversion of category into integers.
- Alphabetical order
sklearn.preprocessing.LabelEncoder - Order of appearance
pd.factorize
- Alphabetical order
from sklearn import preprocessing

# Test data
df = DataFrame(['A', 'B', 'B', 'C'], columns=['Col'])

df['Fact'] = pd.factorize(df['Col'])[0]

le = preprocessing.LabelEncoder()
df['Lab'] = le.fit_transform(df['Col'])

print(df)
#   Col  Fact  Lab
# 0   A     0    0
# 1   B     1    1
# 2   B     1    1
# 3   C     2    2
Frequency Encoding: conversion of category into frequencies.
### FREQUENCY ENCODING

# size of each category
encoding = titanic.groupby('Embarked').size()
# get frequency of each category
encoding = encoding/len(titanic)
titanic['enc'] = titanic.Embarked.map(encoding)

# if categories have same frequency it can be an issue
# will need to change it to ranked frequency encoding
from scipy.stats import rankdata
4.3.2. Non-Tree Based Models
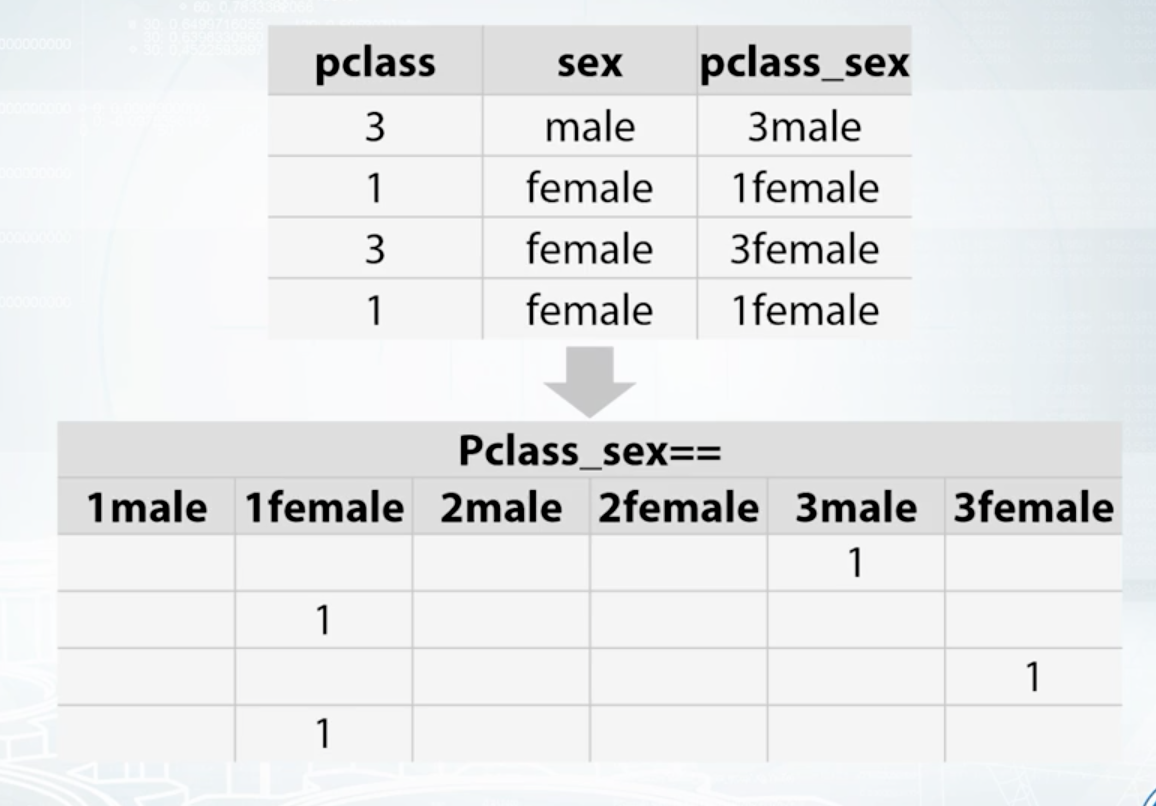
One-Hot Encoding: We could use an integer encoding directly, rescaled where needed. This may work for problems where there is a natural ordinal relationship between the categories, and in turn the integer values, such as labels for temperature ‘cold’, warm’, and ‘hot’. There may be problems when there is no ordinal relationship and allowing the representation to lean on any such relationship might be damaging to learning to solve the problem. An example might be the labels ‘dog’ and ‘cat’.
- Each category is one binary field of 1 & 0. Not good if too many categories in a feature. Need to store in sparse matrix.
- Dummies:
pd.get_dummies, this converts a string into binary, and splits the columns according to n categories - sklearn:
sklearn.preprocessing.OneHotEncoder, string has to be converted into numeric, then stored in a sparse matrix.
- Dummies:
- Feature Interactions: interactions btw categorical features
- Linear Models & KNN
Coursera: How to Win a Data Science Competition
4.4. Coordinates
It is necessary to define a projection for a coordinate reference system if there is a classification in space, eg k-means clustering. This basically change the coordinates from a spherical component to a flat surface.
Also take note of spatial auto-correlation.